January 9, 2018
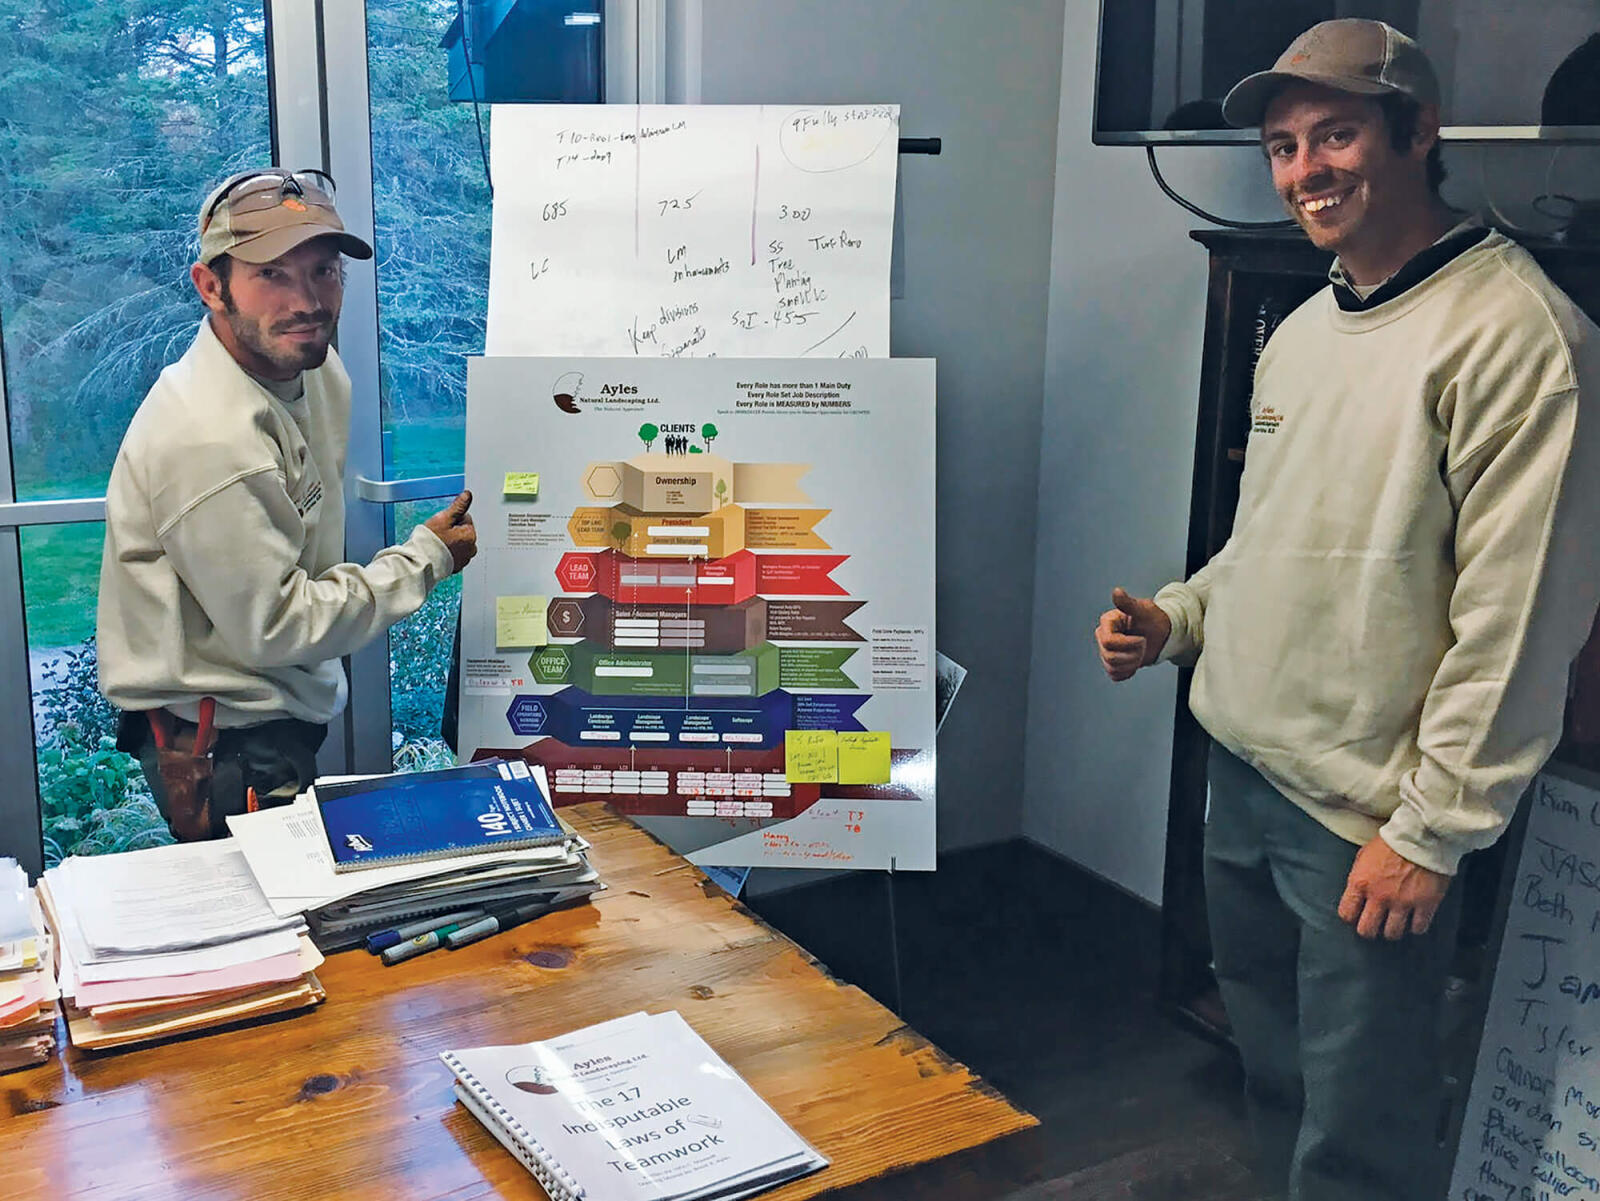
Two landscape management division team members questioning process map details.
Roadmap to growth
BY BRENT AYLES
Many business buzzwords have claimed our attention over the past several years: mission, vision, values, strategy, leadership, mentoring — and most recently, answering the question, “Why?”
The purpose of any business is to deliver a positive, memorable service or product at a profit. That’s Business 101. Over the past several years I have been mentored by some great minds on business strategy and financial management, as well as spiritual, physical, and mental growth. All are very different, and all are important; almost like an orchestra. But the mentoring, leadership training and reading all came down to one thing: our ability to lead others, and help them grow.
A strong desire to grow and develop others led us to collect all our company information together in one place. That’s when we developed what we call our Visual Process Map — a flow chart defining the growth environment within our company.
Was it easy? NO.
Is it a challenge keeping score and reporting the right data every day? YES. Compiling data from many different sources for this process has taken years. And it will take many more years to realize this tool’s potential. It is valuable, because it maps out our company’s ability to grow its people.
The map is a process management tool; its main goal is to measure performance on every level. I got a lot out of a book entitled, “Harrison McCain: Single-Minded Purpose,” a biography by Donald Savoie. The founder of McCain Foods was probably one of the best Canadian self-made entrepreneurs of our century. The slogan, “If you can’t measure it, you cannot manage it” was on the wall in every McCain plant. McCain measured ratios of labour, material and equipment costs. He measured McCain sales vs. the competition. Everything was measured.
Most great companies measure their success with a variety of ratios, used to help guide decision making. Hand-in-hand with the process map, our company uses KPIs — Key Performance Indicators — that clearly tell our people how we measure success. From the client to the account manager to the apprentice, every role has KPIs that everyone can see.
We have worked on implementing our Visual Process Map for over seven years. It was interesting when I paused to take time to reflect — I noticed the team members that asked the most questions along the way are actually the ones that grew and developed the most. The process has worked so well, we are discussing ways to connect the map and associated KPIs more closely with clients.
The map itself could hardly be simpler; it is a poster on the wall. Our company posts a copy on our production shop wall, as well as in our office building. The map is a living document, meaning we expect future changes to promote more organized growth. At the top is the client, to remind us that all changes should improve customer expectations and experiences. It is paramount that every metric in the business supports this point.
The map idea grew from team meetings we had over the years. We learned a lot through failing; most often, not showing clearly what the potential could be. People just want to know that we listen to them.
We don’t always need to make changes, but we need to listen. Showing the team clear rules, and what defines a win in every position, was critical. To this day, we add sticky notes to the process map as we come up with better ideas.
Our small focus-group meetings are interesting; they give employees at all levels an opportunity to ask questions and provide feedback. It takes a lot of energy to compile all the data to make the process map “real.” But when the map creates an engaged team asking questions, which in turn improves client experiences, you know your map has passed the true test and is really working.
As team members ask questions and wonder how they can become more involved, it actually makes their immediate reporting and management responsibilities more accountable. One thing we need to realize is that not every person wants to advance — some are content where they are. It’s just our responsibility to always provide a growth environment.
The single word that sums up our experience with process mapping is repetition. Repetition in structure builds rhythm, which in turn will build momentum.
The most difficult transition facing our industry is the transition from one generation to the next. How does the new generation know what’s important and what isn’t? We developed the Visual Process Map because we wanted a clear picture for everyone to see — we wanted our team to see clearly what they should do to grow and reach their potential. We even have mentoring groups within our company called “Next Generation Leader.” The groups meet bi-weekly, learning together and doing leadership-style training, focused on growing both individual and team strengths.
Getting a process map to work takes many years; things cannot be set in stone. It is not a matter of whether things will change, it is when they will change. Since we developed this visual map, it has brought ideas top-of-mind. It has engaged our entire team to make decisions that are better for our clients. When things are focused on client expectations, everyone has the potential to grow!
Remember: Repetition builds rhythm. Reach out. Ask questions. Challenge the status quo.
Brent Ayles operates Ayles Natural Landscaping in Riverdale, N.B.