 I have often wondered if the damage prevention industry advertising campaigns really work and to what degree. The Ontario Regional Common Ground Alliance (ORCGA) advertises both the Dig Safe and Call Before You Dig messages to the public via various methods. This month, I will look into this question using some data from the ORCGA DIRT Report.
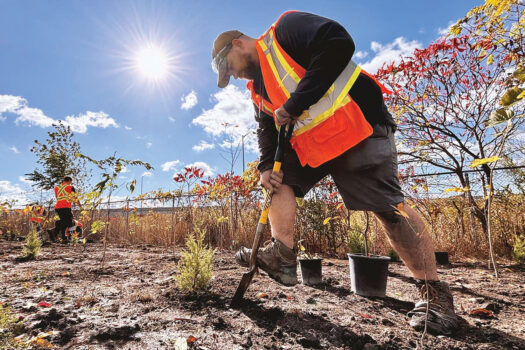
Over the past few years, homeowners have accounted for about 15 per cent of all annual utility hits — almost equal to the number of hits by the landscape sector. For both groups, these numbers are way too high. The average homeowner who plants a tree or shrub, doesn’t really know what utilities are underground or even where they may be located on their property. Why would they? They are focused on the above ground results, and not what dangers may lurk underground. If you asked the public about utility hits and locates, they probably wouldn’t know what you are talking about.
Factors to consider
There are a number of considerations when analyzing the damage prevention industry advertising targeted to homeowners. Industry stakeholders have conducted a number of initiatives over the past few years aimed at reducing the number of homeowner hits. Factors include: the amount of money spent on advertising ON1CALL and the Dig Safe message (print, radio and television), number of homeowners reached at various home and gardens shows (including Canada Blooms / National Home Show), messaging on monthly Union Gas and Enbridge invoices, various events, and visibility of Dig Safe logo and messaging on vehicles, etc. These various initiatives take a lot of effort and funding to reach the public, but are they paying off?
Measurement criteria
It is very difficult to quantify the exact number of people who may happen to see the Dig Safe logo, or notice it on their monthly gas bill. For this reason, I have instead selected two main industry statistics to use for my investigation. First, the actual number of utility hits made by homeowners, and second, a comparison of the annual hits to the total industry hits across the province. The basis for the data in the table below is taken from the ORCGA DIRT Report. Looking at the table, we see the actual number of hits by homeowners varies from year to year, as it does with excavating contractors. Therefore, the key indicator I have selected is the actual number of homeowner hits compared to the total number of industry hits in any one year as a percentage.
The results
Table 1 shows there is a relative downward trend in the annual number of homeowner hits. This is not conclusive, however, because the variations could be a result of the amount of data collected in any one year. The total number of industry hits can also vary each year, because the total number of job sites also fluctuates. However, if you look at the homeowner hits compared to the total industry hits, you will see a steady downward trend of about one per cent each year.
TABLE 1
| YEAR | HOMEOWNER HITS | INDUSTRY HITS | HOMEOWNER PERCENTAGE OF INDUSTRY HITS |
| 2012 | 857 | 4,853 | 17.7% |
| 2013 | 906 | 5,006 | 18.1% |
| 2014 | 623 | 3,872 | 16.1% |
| 2015 | 651 | 4,695 | 13.9% |
| 2016 | 599 | 4,597 | 13.0% |
| 2017 | 631 | 5,149 | 12.3% |
Findings
The downward trend for homeowners has gone from 18.1 per cent to 12.3 per cent over the past four years — almost one per cent each year. This good news would lead me to believe that our advertising and promotional activities are producing results.
Enbridge Gas Distribution advertisements
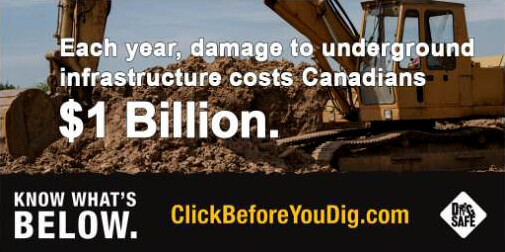
Enbridge has developed a series of graphics that promote the real cost of damage to homeowners. They have been included with monthly invoices and shared via social media. They focus on why the public should be concerned with the cost of damages and promote the ClickBeforeYouDig.com website.
Conclusion
Despite a number of advertising initiatives aimed at homeowners over the past few years, they continue to be responsible for about 15 per cent of all utility hits in the province. However, the number of hits is going down at an annual rate of about one per cent, when compare to the hits responsible for contractors and industry. Our goal is to see solid reductions for both sectors over the next couple of years and new tools and stakeholder participation will continue to be a big part of that effort.
Terry Murphy can be reached at tvmurphy@ca.inter.net.